IDL is an offspring of NASA's Mariner Mars program and nowadays is used by NASA, ESA and DLR (the American, European and German aerospace agencies, resp.) to process data from all major astronomical satellites (such as the Hubble Space Telescope). IDL is particularly suited for working with large data matrices (images) - IDL code working with matrices is typically 50 % to 80% shorter than code written in FORTRAN or VB and considerably faster. In addition visualisation of data is an integrated feature requiring only some additional lines of code. Combined with a large library of mathematical and statistical routines IDL is a perfect tool for geoinformatical research.
REGEOTOP can be seen as a typical example for the need of integrated use of research tools from image processing, GIS, multivariate statistics and geostatistics. Interpolation of discrete point data obtained from measurements of meteorological stations to obtain climate data fileds is still a major problem. The influence of topography is mostly dealt with simple descriptors such as absolute altitude or exposition and slope angle. In order to provide with a more objective method to account for the influence of topography Benichou and Lebreton (1987) have proposed to parameterise topography with the help of a principal component analysis (PCA).
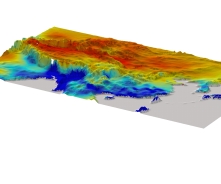
For each element of the DEM a relative topography is obtained by subtracting its elevation from the elevation values of a square window (e.g. 5 by 5 or 11 by 11 elements) centred on that element. In the statistical context each element of the window is seen as a variable and each DEM element is seen as a case or object. After rearranging the results of each window as input data for the PCA each row of the input matrix represents one case and each column represents one variable.
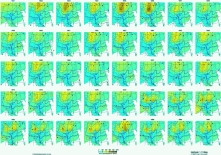
The input matrix is subjected to a R-mode PCA (Richman, 1986). The relative topography in the domain can then be described as a linear combination of the resulting eigenvectors of the minor product of the input matrix weighted by their corresponding principal components (PC). Each eigenvector is interpreted as a 'basic topography' ('paysage du base', Benichou and Lebreton, 1987) representing different basic morphological elements such as domes or depressions, slopes, saddles or parallel ridges of different exposition or different orientation. With decreasing variance PCs explain increasingly complex topographic features that defy easy descriptions. This approach allows to decompose the topography around a station into the PCs of its relative landscape and the absolute altitude of the station itself. As PCs are not correlated with each other they offer an added advantage as predictors for a regression analysis.
Stepwise multiple linear regression is then used to select significant predictors for the observed climatic values (such as a monthly or annual mean value) from relative topographies decomposed into basic topographic components (PCs) and absolute altitude. Application of the regression equation to each element of the DEM then results in a predicted climate data field. The residuals between observed and predicted values are interpolated via a geostatistical method ('kriging') and added to the regression field to account for any remaining spatial variation.
The resulting data fields contain both the influence of small-scale (continentality, monsoon dynamics) and large-scale (topography) forcing factors on climate. Typical topography related effects such as orographically enhanced rain on windward slopes and 'rain-shadow' areas are modelled.